Chapter III: Project Scheduling - PERT and MPM Methods
Mastering Project Planning and Control
Learn how to plan, schedule, and manage complex projects using two powerful network-based methods: PERT (Program Evaluation and Review Technique) and MPM (Méthode des Potentiels Metra / Precedence Diagram Method). From building bridges to launching software, these techniques help ensure projects finish on time!
1. Introduction to Project Scheduling
What is Project Scheduling?
Project scheduling is the process of defining project activities, their durations, dependencies, and determining when each activity should start and finish to complete the project as efficiently as possible.
Why Do We Need Scheduling Methods?
📊 Complexity Management
Modern projects involve hundreds or thousands of interconnected tasks
Example: Building construction with 500+ activities
⏱️ Time Optimization
Identify critical activities that determine project duration
Focus resources where they matter most
💰 Resource Allocation
Plan when and where to deploy workers, equipment, and materials
Avoid bottlenecks and idle time
🎯 Progress Monitoring
Track actual progress against planned schedule
Detect delays early and take corrective action
Real-World Applications
🏗️ Where Are PERT and MPM Used?
- Construction: Building projects, infrastructure development
- Manufacturing: Product development, production line setup
- Software Development: Complex software projects, system implementations
- R&D: Research projects, drug development
- Event Planning: Conferences, weddings, festivals
- Aerospace: Aircraft design, space missions
- Government: Defense projects, public works
2. Historical Development of PERT and MPM
📜 The Birth of PERT (1958)
The Polaris Missile Project
Challenge: The U.S. Navy needed to develop the Polaris submarine-launched ballistic missile system, one of the most complex projects ever undertaken at the time.
The Problem:
- Coordinate 250 prime contractors and 9,000 subcontractors
- Manage thousands of interdependent tasks
- Meet strict military deadlines during Cold War
- Unprecedented technical complexity
The Solution: PERT
Developed by the U.S. Navy Special Projects Office with Booz Allen Hamilton and Lockheed
🎉 Result: Project completed 2 years ahead of schedule (from 6 years to ~4 years)
PERT was credited as a major factor in this success!
🇫🇷 Development of MPM (1960s)
French Innovation
Origin: Developed in France as "Méthode des Potentiels Metra" (Method of Potential Times)
Key Improvements Over PERT:
- Simpler representation: Activities on nodes (not arrows)
- Easier modification: Adding/removing tasks is straightforward
- Direct information: All timing data visible on each task box
- No dummy activities: Cleaner network diagrams
Modern Name: Also known as Precedence Diagram Method (PDM) or Activity-on-Node (AON)
💡 Today: MPM/PDM is the standard method used in modern project management software (Microsoft Project, Primavera, etc.)
| Aspect | PERT (1958) | MPM (1960s) |
|---|---|---|
| Origin | USA (Navy/Defense) | France (Construction/Industry) |
| Initial Use | Polaris missile project | Civil engineering projects |
| Network Type | Activity-on-Arrow (AOA) | Activity-on-Node (AON) |
| Current Status | Historical, educational | Industry standard |
3. Fundamental Concepts in Project Scheduling
Key Terminology
🔷 Activity (Task)
Definition: A specific work operation that consumes time and possibly resources
Examples:
- "Pour foundation" (construction)
- "Code login module" (software)
- "Conduct clinical trial" (pharmaceutical)
Characteristics:
- Has a defined beginning and end
- Requires a specific duration
- May require resources (people, equipment, materials)
⏱️ Duration
Definition: The time required to complete an activity
Units: Days, weeks, hours (must be consistent across project)
Example: Activity A has duration = 5 days
🔗 Precedence Relationship (Dependency)
Definition: Logical constraints defining which activities must finish before others can start
Example: "You must pour the foundation before you can erect walls"
Types of Dependencies:
- Finish-to-Start (FS): Most common; B starts when A finishes
- Start-to-Start (SS): B can start when A starts (parallel work)
- Finish-to-Finish (FF): B finishes when A finishes
- Start-to-Finish (SF): Rare; B finishes when A starts
Note: Basic PERT and MPM use only Finish-to-Start relationships
⭕ Event (PERT only)
Definition: A point in time representing the start or completion of one or more activities
Important: Events have zero duration (they are milestones, not work)
Example: "Foundation completed" is an event
🚨 Critical Path
Definition: The longest path through the network from start to finish
Importance: Determines the minimum project duration
Critical Activities: Activities on the critical path have zero float; any delay delays the entire project!
Time Concepts
📅 Earliest Start Time (ES)
Definition: The earliest possible time an activity can begin, considering all predecessor constraints
ES = max(EF of all immediate predecessors)
📅 Earliest Finish Time (EF)
Definition: The earliest possible time an activity can finish
EF = ES + Duration
📅 Latest Start Time (LS)
Definition: The latest time an activity can start without delaying the project
LS = LF - Duration
📅 Latest Finish Time (LF)
Definition: The latest time an activity can finish without delaying the project
LF = min(LS of all immediate successors)
Float (Slack) Concepts
⏳ Total Float (Total Slack)
Definition: The maximum amount of time an activity can be delayed without delaying the project completion
Total Float = LS - ES = LF - EF
Interpretation:
- TF = 0: Critical activity (no flexibility)
- TF > 0: Non-critical activity (can be delayed)
Example: If ES = 5, LS = 8, then TF = 3 days → Activity can start 3 days late without affecting project
⏳ Free Float (Free Slack)
Definition: The amount of time an activity can be delayed without affecting the earliest start of any successor
Free Float = min(ES of successors) - EF
Interpretation: Free float is "safer" slack—using it doesn't affect any other activities
Note: Free Float ≤ Total Float (always)
💡 Practical Difference:
- Total Float: "I can delay this activity X days, but it might affect downstream scheduling flexibility"
- Free Float: "I can delay this activity X days with no impact on anything else"
4. PERT Method (Program Evaluation and Review Technique)
What is PERT?
PERT is a network-based technique that uses an Activity-on-Arrow (AOA) representation where:
- Nodes (circles) represent events (milestones)
- Arrows represent activities (work tasks)
- Activity durations are shown on arrows
PERT Network Components
⭕ Events (Nodes)
Representation: Circles or boxes
Content: Event number/name
Duration: Zero (instantaneous milestone)
Events mark completion points, not work
➡️ Activities (Arrows)
Representation: Directed arrows
Content: Activity name and duration
Direction: Shows precedence
Arrow goes from predecessor event to successor event
⤵️ Dummy Activities
Representation: Dashed arrows
Duration: Zero
Purpose: Show dependencies without actual work
Used to maintain correct precedence logic
PERT Network Construction Rules
- Each activity is represented by one and only one arrow
- Each event (node) has a unique identifier
- No two activities can have the same start and end events (use dummy if needed)
- Network flows from left to right (time progression)
- No loops allowed (can't go backward in time)
- One start event and one end event for the entire project
- Every event (except start) must have at least one incoming activity
- Every event (except end) must have at least one outgoing activity
Step-by-Step PERT Construction
🔧 Step 1: List All Activities
Create a table with all project activities and their properties:
| Activity | Description | Duration | Immediate Predecessors |
|---|---|---|---|
| A | Site preparation | 3 days | — |
| B | Order materials | 4 days | — |
| C | Pour foundation | 2 days | A |
| D | Inspect site | 3 days | A |
| E | Erect frame | 4 days | B, C |
🔧 Step 2: Identify Precedence Relationships
Determine which activities must be completed before others can start:
- A and B can start immediately (no predecessors)
- C and D require A to be completed first
- E requires both B and C to be completed
🔧 Step 3: Draw the Network
Process:
- Start with a single start event (Event 1)
- Draw activities with no predecessors from start event
- Progress through activities in logical order
- Use dummy activities if needed to maintain correct logic
- End with a single finish event
Example PERT Network: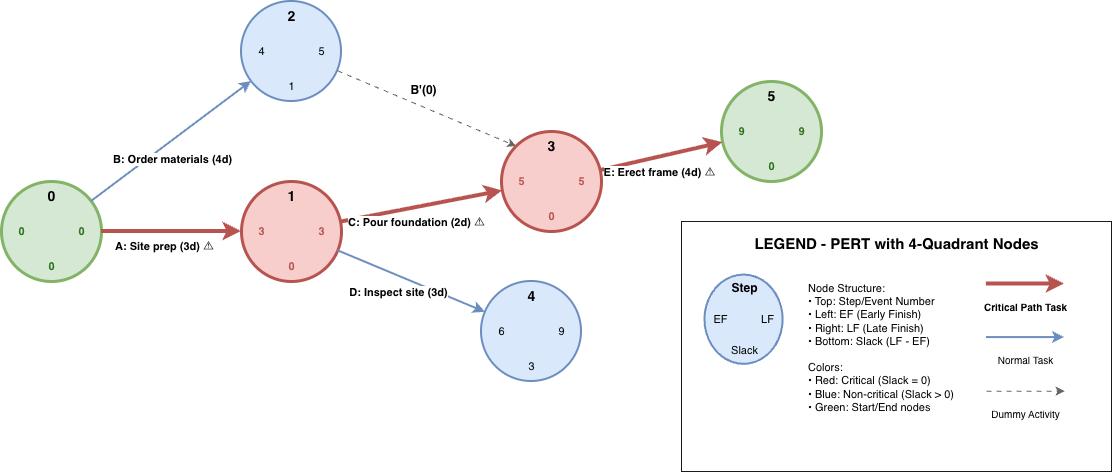
Activities shown with durations in parentheses
5. PERT Calculations: Forward and Backward Pass
Step 1: The Forward Pass (Earliest Times)
- Start at the first event: Set its earliest time (ES or t0) = 0.
- For each subsequent event: Earliest time is
ti = max(tj + dj→i), for all predecessors j, where dj→i is the duration of the activity from j to i. - Continue until all nodes are labeled with earliest occurrence times.
- The project duration is the earliest time at the final event (exit node).
Step 2: The Backward Pass (Latest Times)
- Start at the final event: Set its latest time (LF = EF = project duration).
- For each preceding event: The latest time is
t'j = min(t'i - dj→i), for all successors i. - Proceed backwards until all nodes are labeled with latest allowable occurrence times.
Step 3: Determining Floats and Critical Path
- Total float of an activity (i → j): TF = t'j - ti - di→j
- Critical activities: Those with TF = 0; together, these form the critical path.
- Critical path: The sequence of activities from start to finish with zero total float; determines project duration.
Example: Calculating Early/Late Times and Floats
Given:
- Activity List:
- A (3 days), no predecessors
- B (4 days), no predecessors
- C (2 days), after A
- D (3 days), after A
- E (4 days), after B and C
Question:
Find:
- Earliest Start and Finish times for each activity
- Latest Start and Finish times for each activity
- All floats and identify the critical path
- Total project duration
| Activity | ES | EF | LS | LF | Total Float |
|---|---|---|---|---|---|
| A | 0 | 3 | 0 | 3 | 0 |
| B | 0 | 4 | 1 | 5 | 1 |
| C | 3 | 5 | 3 | 5 | 0 |
| D | 3 | 6 | 5 | 8 | 2 |
| E | 5 | 9 | 5 | 9 | 0 |
- Project duration = 9 days (longest path: A→C→E)
- Critical Path: A-C-E
6. MPM Method (Méthode des Potentiels Metra / Precedence Diagram Method, PDM)
What is MPM?
MPM is a node-based project scheduling method where:
- Boxes (nodes) represent activities, not events
- Arrows show dependencies (Finish-to-Start logic, unless otherwise specified)
- All timing (earliest/latest starts/finishes, floats) are shown directly on each activity box for easy reading
- No dummy activities needed (unlike classic PERT)
MPM is widely used in engineering, construction software (e.g., MS Project), and research.
MPM Box Format
| ES | Activity Name | EF |
| LS | Duration | LF |
ES = Earliest Start, EF= Earliest Finish, LS = Latest Start, LF = Latest Finish
Steps in MPM Scheduling
- List all activities with durations and dependencies.
- Draw each activity as a node (box), with arrows for logical relationships.
- Compute earliest start times (ES) by a forward pass through the network.
- Compute latest finish/start times (LF/LS) by a backward pass.
- Calculate floats and identify the critical path (all activities with zero float).
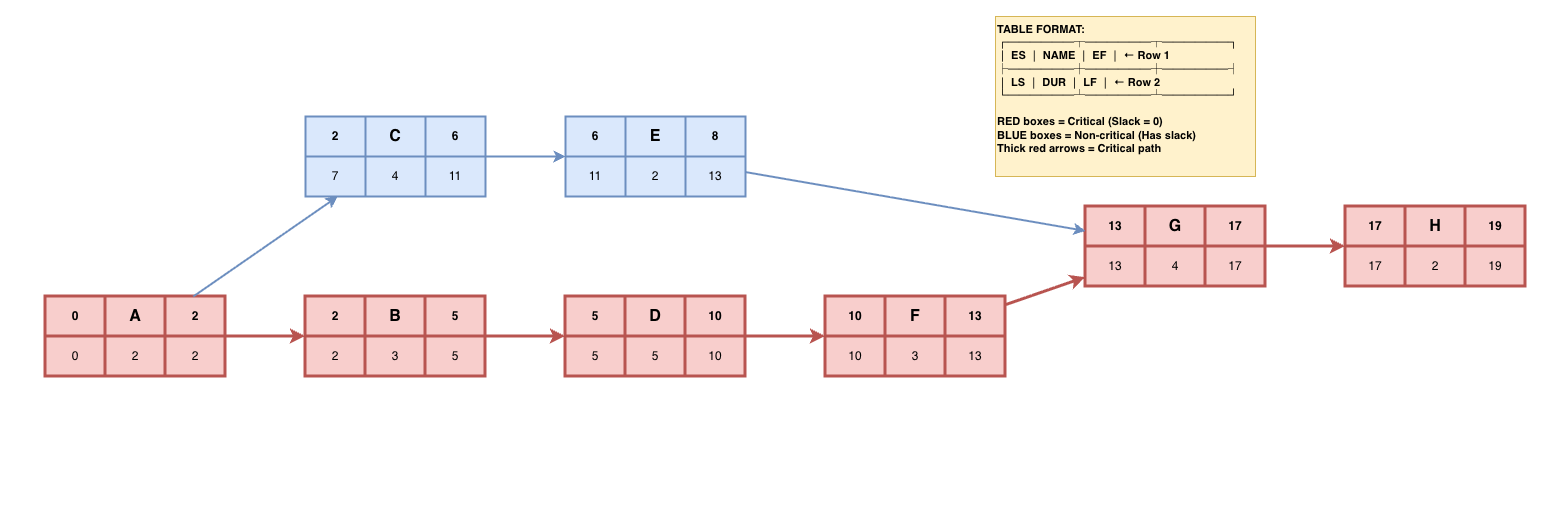
Example: MPM (AON/PDM) Network
| Activity | Description | Duration | Predecessors |
|---|---|---|---|
| A | Requirements Review | 2 days | — |
| B | Test Plan Creation | 3 days | A |
| C | Test Environment Setup | 4 days | A |
| D | Test Case Design | 5 days | B |
| E | Test Data Preparation | 2 days | C |
| F | Unit Testing | 3 days | D |
| G | Integration Testing | 4 days | E, F |
| H | Test Report | 2 days | G |
.
7. PERT vs MPM - Which to Use?
| Feature | PERT (AOA) | MPM/PDM (AON) |
|---|---|---|
| Activity Representation | On arrow (between nodes) | On node (box) |
| Events (Milestones) | Explicit (numbered junctions) | Implicit (network structure) |
| Dummy Activities | Required (to show certain dependencies) | Not needed |
| Data Visualization | Durations shown on arrows | All times (ES, EF, LS, LF, float) shown in activity box |
| Software Support | Limited (mainly educational) | Universal (MS Project, Primavera, etc.) |
| Modern Use | Rare, for teaching | Industry standard |
Bottom Line: Learn PERT for historical understanding and exams, but use MPM/PDM (AON) for real projects and modern tools.
8. Practice Examples
Example 1: Small Network Calculation
| Activity | Predecessor(s) | Duration (days) |
|---|---|---|
| A | — | 5 |
| B | A | 6 |
| C | A | 4 |
| D | B,C | 7 |
- Draw PERT and AON networks.
- Compute early/late times, floats, and critical path.
- Check with at least two students/colleagues, compare answers.
9. Exercises and Self-Assessment
Exercise 1: Network Drawing and Analysis
Given the following table, draw the PERT and MPM networks and find the critical path, project duration, and all floats.
| Activity | Predecessors | Duration |
|---|---|---|
| A | — | 2 |
| B | — | 4 |
| C | A | 3 |
| D | B, C | 6 |
| E | C | 2 |
| F | D, E | 3 |
Tip: Practice both hand-drawn and software-generated diagrams.
Self-Check Questions
- What is the difference between total float and free float?
- Why do modern project managers prefer AON/PDM over classic PERT?
- Can a project have multiple critical paths? Under what circumstances?
- How does activity duration uncertainty affect the use of PERT?
- What are dummy activities, and why are they avoided in the MPM method?
- How would you explain the critical path to a non-technical stakeholder?
10. Software Tools and Resources
Microsoft Project
- Industry-standard for Gantt charts and AON scheduling
- User-friendly, graphical drag-and-drop interface
- Critical path computation and reporting
- Ideal for real-world, multi-resource project planning
Primavera P6 (Oracle)
- Widely used in large construction and engineering projects
- Supports WBS, AON, resource leveling and monitoring
- Detailed analytics, reporting and multi-user support
Open Source: ProjectLibre, GanttProject
- Free Gantt/PERT and AON software for students
- Most features of MS Project for small/medium-sized projects
- Easy network diagramming and basic resource management
Online Diagramming Tools: Lucidchart, Draw.io
- Create and share PERT/AON diagrams online
- Good for homework, presentations, and group work
- Templates for network diagrams available
YouTube and Video Tutorials
- Search: “PERT algorithm”, “Critical path method”, “MPM scheduling”
- MIT OpenCourseWare, Project Management Institute (PMI) videos
- Visualization of critical path and float explained
11. Recommended Textbooks & Online Resources
📖 Key Textbooks
- Introduction to Operations Research, by Hillier & Lieberman (extensive PERT/CPM/MPM chapters, examples, and exercises)
- Project Management: A Systems Approach, by Harold Kerzner (in-depth project scheduling, real-world cases)
- Operations Research: Applications and Algorithms, by Wayne Winston (well-explained critical path, float, network algorithms)
- CPM and PERT: A Practical Guide, by Joseph Moder & Cecil Phillips (classic focused text on network scheduling)
- Fundamentals of Project Management, by Joseph Heagney (practical primer for new project managers)
🌐 Online Resources
- MIT OpenCourseWare: Search "Critical Path Method", "PERT", or "Project Scheduling"
- Coursera (Project Management Principles and Practices Specialization, UC Irvine; Fundamentals of Project Planning and Management, University of Virginia)
- edX (Project Management MicroMasters, RIT; Construction Scheduling, Columbia University)
- YouTube playlists: "PERT and CPM Explained", "Critical Path in MS Project"
- PMI (Project Management Institute): pmi.org, standards and articles
- Lucidchart, Draw.io: Free templates for network diagrams
- ProjectLibre: https://www.projectlibre.com/
- GanttProject: https://www.ganttproject.biz/
- OR-Exchange Q&A: or.stackexchange.com (scheduling, algorithms, practice questions)
✔️ Chapter Complete: Project Scheduling Mastery
With PERT and MPM/Precedence Diagram methods, you are ready to analyze and optimize the timing of any project. These practical tools are essential for engineers, developers, and project managers.
Next: Try modeling and analyzing your own scheduling challenge—or explore further with advanced topics such as resource-constrained scheduling and probabilistic network analysis!